Among the strategy analysis tools, we find Wardley Maps, which are not very widespread but simple to use and very effective. Wardley Maps are a business strategy tool that allows to graphically visualize the value of the components of a system, their dependence and their degree of maturity. With this map it is possible to identify opportunities for innovation, competitive threats and areas for improvement in the organization.
What are Wardley Maps?
Wardley Maps are named after Simon Wardley, who developed the method based on his experience as a CEO, strategist, and researcher. He first published his ideas in 2015 in a series of online articles, and later in a book titled “Wardley Maps: Topographical Intelligence in Business”.
Wardley Maps are composed of two axes: the horizontal axis represents the evolution of a component from genesis (novel and uncertain) to commodity (standardized and well-defined), and the vertical axis represents the visibility of a component to the customer or user. A component can be anything that provides value to the customer or user, such as a capability, a product, a service, a process, a platform, etc.
The evolution axis reflects the maturity and adoption of a component in the market. As a component evolves, it becomes more efficient, reliable, ubiquitous, and cheaper. However, it also becomes more predictable, less differentiated, and more exposed to competition. The evolution axis can be divided into four stages: genesis, custom-built, product (+rental), and commodity (+utility).
The visibility axis reflects the importance and awareness of a component to the customer or user. A component that is highly visible is directly related to the value proposition and the customer experience. A component that is less visible is more supporting or enabling in nature. The visibility axis can be divided into two zones: customer-facing and non-customer-facing.
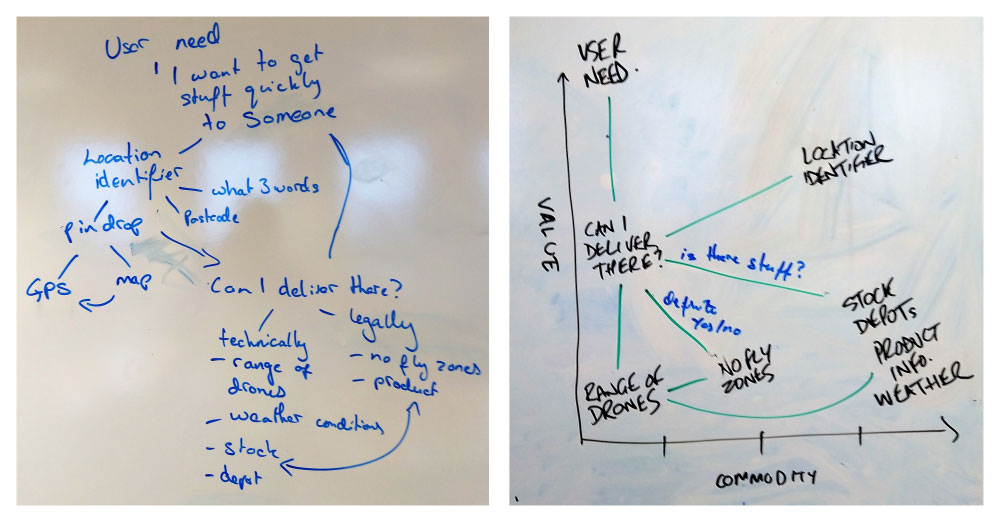
A Wardley Map is created by mapping the components that are relevant to a specific context or goal on the two axes. The components are connected by lines that indicate their dependencies. The result is a visual representation of the current state of the system or domain that is being analyzed.
Why use Wardley Maps?
Wardley Maps have several benefits for strategic planning and decision making. They help you:
- Understand the context and situation you are in
- Identify the opportunities and threats in your environment
- Assess the strengths and weaknesses of your current position
- Determine the direction and actions you need to take
- Communicate and align with your stakeholders
Wardley Maps are based on the premise that everything evolves from genesis (novel and uncertain) to commodity (standardized and well-defined) through four stages: custom built, product (+rental), commodity (+utility), and ubiquity. The evolution of a component depends on the supply and demand of the market, as well as the constraints and inertia of the existing system.
Wardley Maps help you understand where you are, where you want to go, and how to get there. They help you align your actions with your purpose, and communicate your strategy to others. They also help you anticipate and respond to change, by identifying the opportunities and threats in your environment.
To create a Wardley Map, we need to follow four steps:
- Define the scope and purpose of your map. What is the context and goal of your strategy? Who are your users and what are their needs?
- Map the value chain. What are the components that deliver value to your users? How do they depend on each other? How mature and evolved are they?
- Map the landscape. Where are the components positioned on the map? How visible are they to the user? How stable are they? How competitive are they?
- Apply patterns. What are the forces and trends that affect your landscape? What are the universal principles and practices that guide your actions? What are the context-specific moves and tactics that you can use to improve your position?
Example
An example of a Wardley Map could be the following:
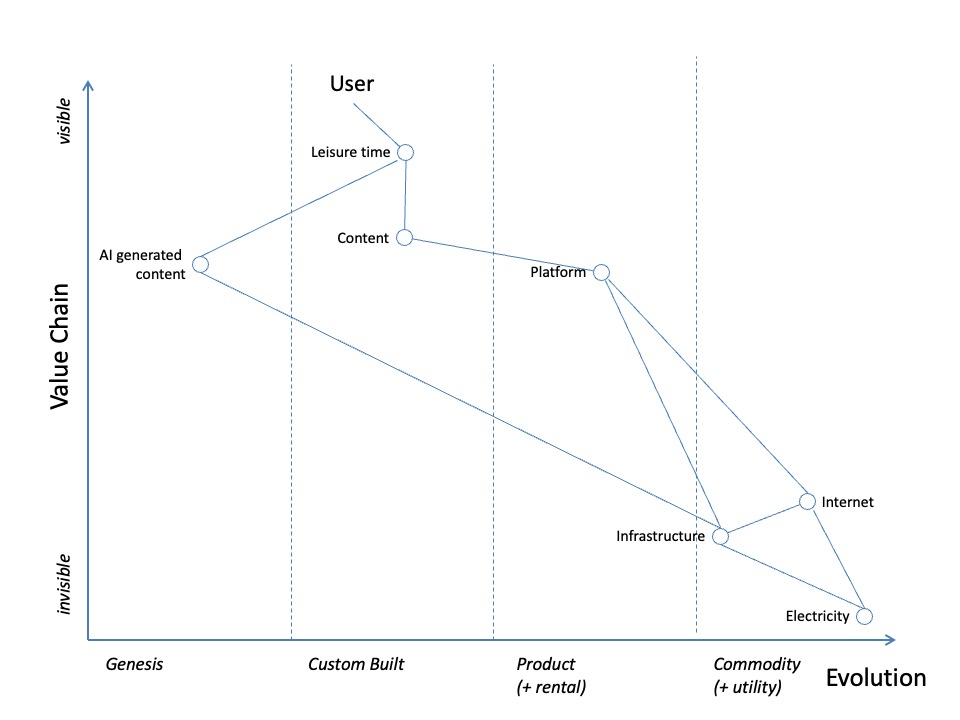
In this map it can be seen that the streaming service is composed of several components, such as content, platform, infrastructure, electricity and internet. Each of these components has a different degree of evolution: the content is customized and rare, the platform is a differentiated product, the infrastructure is a standardized commodity, the electricity is a regulated commodity and the internet is a public commodity. Customer value is concentrated in the content and platform, which are the most visible and direct, while the other components are invisible and indirect.
Several conclusions can be drawn from this map:
- Content is the key factor in differentiating yourself from the competition and building customer loyalty. Therefore, you should invest in creating original and quality content, as well as in acquiring exclusive licenses. AI-generated content is still in its early stages of evolution.
- The platform is the factor that facilitates access to content and the user experience. Therefore, the design, usability, security and personalization of the platform must be optimized.
- The infrastructure is the factor that guarantees the availability and performance of the service. Therefore, it should be outsourced to a specialized provider that offers a scalable, flexible and cost-effective solution.
- Electricity and Internet are factors that do not depend on the service provider, but on market and environmental conditions. Therefore, you should be aware of possible variations in the supply and quality of these services.
Wardley Maps allow us to have a global and strategic vision of the business, as well as to anticipate and adapt to changes. Organizations can use Wardley Maps to align IT strategies with business strategy, prioritize projects and initiatives, manage resources and suppliers, and communicate value to stakeholders.
Some aspects to keep in mind is that Wardley Maps are not static, but dynamic. They change as the world changes and as the way of understanding it changes. They are not prescriptive, but descriptive. They don’t tell you what to do, but help us think about what to do. They are not a silver bullet, but a lens. They help us see what others don’t see and act accordingly.
To read more about Wardley Maps, I recommend reading the book Wardley Maps by Simon Wardley, the creator of this methodology. Some more resources: