Although it may seem from the image that we will talk about Dora the explorer, it is not so; although it could be, since lately I see many chapters of her. Let’s talk about DORA (DevOps Research and Assessment) metrics.
In the acronym DORA itself appears named DevOps, and is that the successful implementation of DevOps has become a key objective for many organizations, since the dependence on developed software is increasing. The DevOps approach seeks to improve collaboration between development and operations teams, accelerate software delivery, and increase the quality and reliability of applications. To measure and improve the effectiveness of DevOps practices, DORA metrics have established themselves as a valuable aid.
DORA metrics are a set of key performance indicators (KPIs) developed by Google’s research team to assess and quantify the performance of DevOps initiatives. These metrics focus on four main areas in their original version (2020) and later expanded with a fifth area:
- Deployment frequency: frequency with which an organization moves to production.
- Change lead time: time it takes for a commit to go to production.
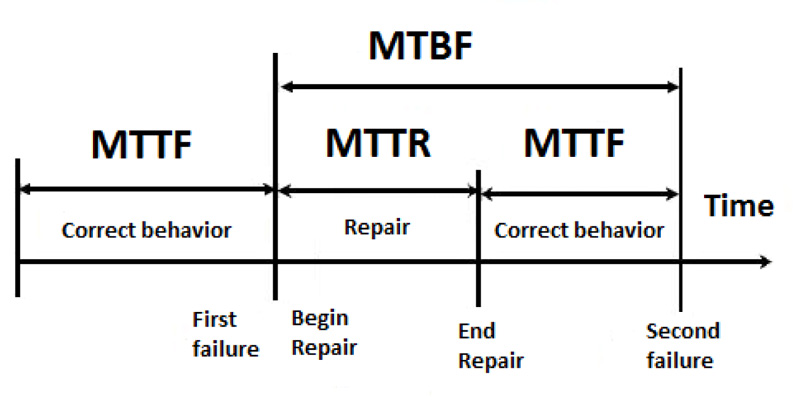
- Average recovery time: time it takes for an organization to recover from a failure in production.
- Change failure rate: percentage of deployments that result in a production failure.
- Reliability: ability to meet or exceed your reliability targets.
DORA metrics have become the standard for measuring the effectiveness of software development teams and can provide crucial information about areas of growth. These metrics provide a holistic view of the state of DevOps implementation and help organizations identify areas for improvement and set clear goals; we can say that they are essential for organizations looking to modernize and for those that want to gain an edge over their competitors. Let’s look in a little more detail at the first four metrics that are the most widespread.
Deployment frequency
Deployment Frequency (DF) is the frequency with which changes are deployed to production, i.e. the consistency with which the software is delivered to the end user. This metric is beneficial in determining whether a team is meeting delivery targets. According to the DORA team, we can classify performance according to these benchmarks for deployment frequency:
- Elite Performance: Several times a day.
- High performance: Once a week to once a month
- Medium performance: Once a month to once every six months
- Low Performance: Less than once every six months
The best way to optimize the FD is to perform small deployments by grouping several changes together, rather than waiting until you have a lot of changes accumulated. This will help us detect failures earlier and it will be easier to find them since the changes are smaller. In addition, it can help reveal bottlenecks in the development process or indicate that projects are too complex.
Lead time for changes
Lead time for changes (LTC) is the time that elapses between the completion of a commit and its release to production. The LTC indicates the degree of agility of a company in bringing available code into production. There is little point in teams committing updated code very quickly if the changes are not then transported to production. The DORA team identified these performance benchmarks:
- Elite performance: Less than one hour
- High performance: One day to one week
- Medium yield: One month to six months
- Low performance: More than six months
LTC can help us reveal inefficiencies in the process if teams take weeks or months before they can see their code in production. The causes can be many, such as testing times or specific time windows for joint deployments. In this sense, the use of continuous integration and continuous delivery (CI/CD) techniques help to minimize LTC. Encouraging the operations team and developers to collaborate closely or even setting joint objectives are levers that help everyone to collaborate and have a thorough knowledge of the software, minimizing LTC. In the same field, creating automated tests and scans integrated into CI/CD pipelines will save much more time and improve the overall process.
Since there are several phases between the initiation and deployment of a change, it is useful to define each step in the process and track how long each one takes. In this way, we can easily detect bottlenecks or anomalies in a particular case. By examining the cycle time, we can get a complete picture of how the equipment is performing and more information on where it can be optimized to save time.
As with everything in this life, we must keep an eye on a balance when it comes to improving LTC. If we improve LTC but strain the team to keep up, we may have people who are under too much pressure and end up leaving the organization or introduce quality failures by sacrificing user experience. Clearly undesirable effects.
Although we may be tempted to compare the performance of one team to another, we must keep in mind that the difficulty of the tasks assigned or the domain in which they work may not be comparable. Rather than comparing the team’s LTC with that of other teams or organizations, it is better to evaluate this metric over time and consider it as an indicator that measures the growth or stagnation of that team.
Mean Time To Recover
Mean Time To Recover (MTTR) is the average amount of time it takes for equipment to restore service when a production outage, such as a power outage, occurs. This metric provides insight into the time it takes for a system to recover.
- Elite performance: Less than one hour
- High performance: Less than one day
- Medium performance: One day to one week
- Low performance: More than one week
To minimize the impact of a degraded service on the value stream, there should be as little downtime as possible. Depending on the criticality of the services deployed and the time it takes to restore services, consideration should be given to the possibility of using indicators as alarms to be able to quickly deactivate a change that causes degradation, without causing too much disruption. Quantifying the economic losses for each hour of service downtime can help determine the criticality of the service. As we have seen, if deployments are done in small batch shipments, it will be easier to discover and resolve problems, improving the MTTR.
Another metric we can have within this field is Mean Time To Discover MTTD (Mean Time To Discover MTTD) which is different from Mean Time To Recovery. The time it takes for your equipment to detect a problem will influence your MTTR: the faster your equipment detects a problem, the faster service can be restored.
Drastic changes to improve the MTTR, for example by decreasing the number of tests before deployment, can introduce quality losses, which we can monitor with the following indicator. This is why it is better to introduce small changes in the process to ensure that they are lasting and complete and to monitor the MTTR over time to see how the whole thing evolves.
Change failure rate
Change Failure Rate (CFR) is the percentage of releases that result in downtime, service degradation or rollback of what was deployed. This indicator shows the effectiveness of a team in implementing changes.
- Elite performance: 0%-15%.
- High performance: 16%-30%.
- Medium performance: 16%-30%.
- Low performance: 16%-30%
This metric is very valuable because it shows that doing many deployments does not bring more value. Deployments must be free of failures and not degrade the service. This is a percentage measure, which avoids that teams that make few deployments, by having few failures, may think that they are more successful in implementing. In other words, if we are in an environment where CI/CD practices are followed, we may see a higher number of failures due to the multitude of deployments, but if the CFR is low, these teams will have a high overall success rate and a higher rate of successful deployment.
Another insight we can take from this metric is how much time is spent troubleshooting rather than developing new projects, which directly impacts the value stream. Again, the best thing about this indicator is that it is not compared between teams or organizations and that it is tracked within the team itself, establishing specific objectives in each case and monitoring its evolution.
Joint View
These four metrics separately can give us insight into the way in which you operate, but it is when they are combined and considered together in the same context that you get the most information. Wait time for changes and deployment frequency provide information about the speed of a team and how quickly they respond to the (ever-changing) needs of users. On the other hand, mean recovery time and change failure rate indicate the stability of a service and the team’s responsiveness to outages or failures.
By comparing the four key metrics, it is possible to assess the extent to which the organization balances speed and stability. If the lead time for changes is within a week, but the failure rate for changes is high, then teams may be forcing changes to be deployed before they are ready, or may not be spending the time necessary to test. If, on the other hand, they deploy once a month and their mean recovery time and change failure rate are high, then the team may be spending more time fixing code than improving the product.
Because DORA metrics provide a high-level view of team performance, they are very beneficial for organizations trying to modernize and deliver better results. DORA metrics can help identify exactly where and how to improve software production. Over time, teams can measure where they have grown and where they have stalled and can focus efforts on certain areas of improvement.
However, DORA metrics are only one tool. To get the most out of them, managers need to understand the organization and teams and use that knowledge to guide their goals and determine how to effectively invest and focus their resources.
The biggest challenge here is how to collect and treat the data to arrive to these metrics. Technology dispersion and different processes between teams are things that will not help to get usable metrics