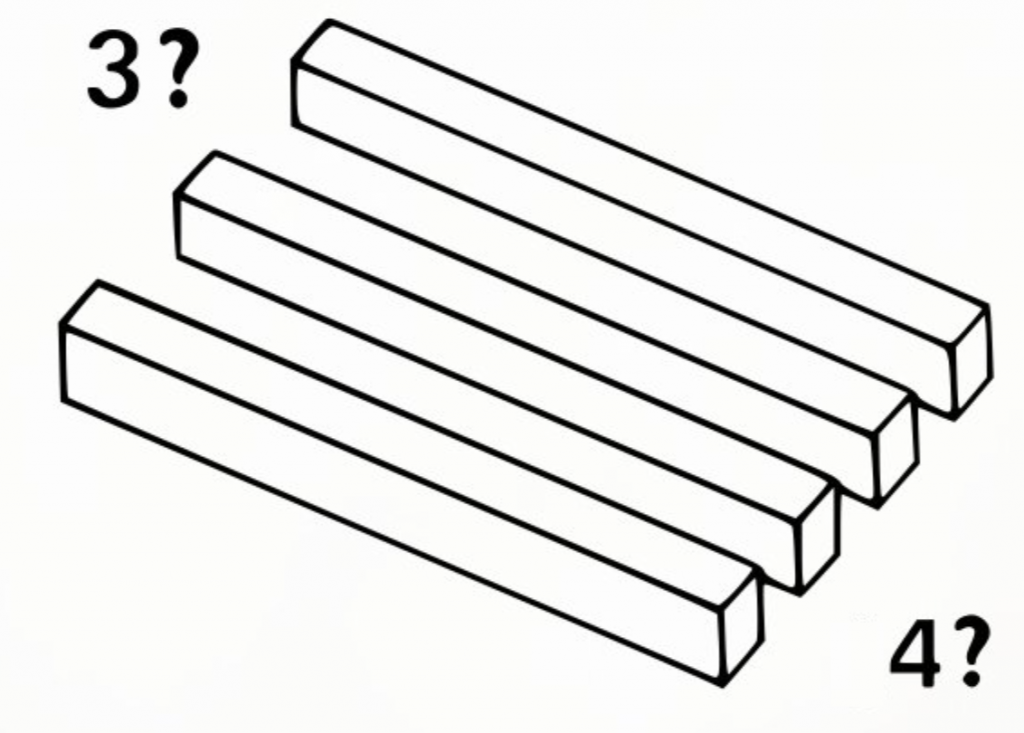
In life we use different maps to represent different aspects of a particular area. Thus, we have political, geographical, climatic, urban, topographical, traffic maps, etc.
Which one is better? Well, as Jarabe de Palo said in their song:
It depends, what does it depend on?
It depends on how you look at it, it all dependsDepende -Jarabe de Palo
There is no one map that is valid for all cases and, although we can add several concepts to the same map, for the sake of clarity it is always advisable to use different ones depending on what we want to see or analyze.
The same thing happens in the business world. Hand in hand with architecture, we can obtain diagrams that are much more than simple visual representations. Diagrams are narrative tools that communicate strategies, processes and organizational structures; they tell stories.
The common mistake is to try to create a “universal diagram” that can be used for all audiences and purposes. This not only dilutes the message, but can also generate confusion or even resistance from those who do not see their specific concerns reflected.
Not all diagrams are the same, nor should they be. This is where the concept of viewpoints comes into play, an essential element in deciding what to show, how to show it and who to address it to. The key is to understand that the design of a diagram intrinsically depends on the story we want to tell.
What are viewpoints?
A viewpoint is, in essence, a specific perspective from which information about a system is observed and represented in a model or diagram. It is not just a technical cut-out of the system, but a deliberate and conscious choice about which aspects to highlight and which to omit or leave in the background. It’s like looking at a city from different angles: from the ground you can see the streets and nearby buildings, while from a drone you get a panoramic view that reveals broader patterns but you will lose other details.
For example, a diagram can focus on operational processes (operational view), strategic capabilities (capabilities view), or interactions between technological systems (technical view). Each viewpoint responds to a specific need and a specific audience; they are filters that we apply to show only the information relevant to a specific purpose or audience. This does not mean hiding information, but prioritizing what is most important depending on the message we want to convey. Each diagram tells the story from a different point of view and that is why they should not be the same.
Think of it as if we were directing a movie: the script defines the plot, but the camera decides how it is told. If the objective is to show the alignment between strategy and operations, the viewpoint will include elements such as business objectives, key performance indicators (KPIs) and critical processes. If, on the other hand, we seek to explain technological integration to technical team, the focus will be on systems, data and information flows.
Narrative as the axis of design
The choice of viewpoint and what it should include is not arbitrary; it depends on the target audience, the story we want to convey and the breadth and depth we want to give it. Let’s imagine that we are presenting a case for digital transformation to senior management. The narrative could revolve around how new technological capabilities will drive business growth. In this case, a high-level diagram with a strategic view — connecting capabilities, objectives and benefits — will be more effective than a detailed one about data flows. On the other hand, if the audience is technical teams, the story changes: now we will need a viewpoint that details interfaces, systems and dependencies.
What we want to tell and who we want to tell it to is what should make us think about different diagrams. It’s not about showing everything in a single diagram (which usually results in confusion), but about adapting the content to the narrative. A good story doesn’t overwhelm with unnecessary details; it selects the elements that give meaning to the message and presents them clearly.
Key dimensions
Three key aspects are considered in the design of effective diagrams or viewpoints:
1. Audience
Before starting to design any diagram, we have to ask ourselves: Who will see it? What level of knowledge do they have about the subject? What do they care about? For example:
- A CEO will be interested in strategic results.
- An analyst will want operational details.
- A development team will look for clear technical specifications.
Adapting the viewpoint to the needs of the audience ensures that the message is relevant and understandable. A script and images for a children’s film is not the same as one for an adult film.
2. Purpose
Clearly define what you want to achieve with the diagram, the story you want to support with it:
- Is it for making decisions?
- Is it for explaining a concept?
- Is it for identifying problems?
The purpose guides what information to include and how to present it. If we are presenting strategic options, we need to focus on clear alternatives and their implications. If it is about documenting a process, we need to make sure we include all the relevant steps.
3. Level of abstraction
We need to determine how detailed the diagram should be:
- High abstraction: Ideal for executive audiences or strategic discussions. It shows only the key elements.
- Medium abstraction: Useful for cross-functional teams that need to understand how the different components fit together.
- Low abstraction: Designed for technical specialists who need precise details.

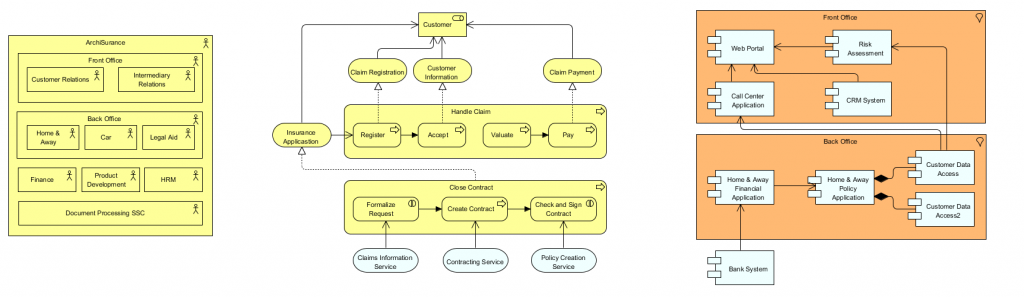
Some examples
Viewpoints can transform the same model depending on the context:
Business Capabilities Model
- Strategic viewpoint: Shows only the critical capabilities aligned with the strategic objectives.
- Operational viewpoint: Includes all the capabilities necessary to execute a specific process.
- Technical viewpoint: Details the capabilities enabled by specific systems.
Process Map
- Executive viewpoint: Highlights the key points of the value stream and how they impact the end customer.
- Collaborative viewpoint: Includes all the steps in the process to facilitate discussions between teams.
- Analytical viewpoint: Adds metrics such as cycle times or costs associated with each step.
Viewpoints are the lens through which we bring our stories to life and the diagram is their representation. There is no universal design; each diagram should be an answer to the question: what does this audience need to know, right now, in order to move forward? A diagram is not just a set of lines and boxes; it is a visual narrative. And it is not just about creating good and nice diagrams; it is about telling good visual stories that inspire action and understanding.
It’s really something we don’t take into account and it’s very important, it’s not just telling data, it’s telling stories. Jobs was a genius at that